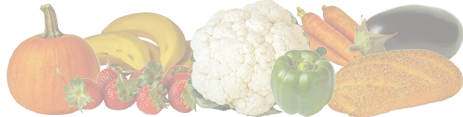
Fruits
ac..av, ba..bo, br..ch, cl..da, da..gr, gr..ki, ku..lo, ma..ol, or..pe, pe..pl, po..ro, sa..wa
| mamey sapote | mammy-apple | mango | melon (cantaloupe) |
melon (casaba) |
melon (honeydew) |
mulberries | nance (frozen) |
nectarine | olives, ripe (canned) |
|
| Serving Size | 100 g | 100 g | 100 g | 100 g | 100 g | 100 g | 100 g | 100 g | 100 g | 100 g |
| Macronutrients | ||||||||||
| Calories (kcal) | 124 | 51 | 60 | 34 | 28 | 36 | 43 | 73 | 44 | 115 |
| Protein (g) | 1.45 (3%) | 0.50 (1%) | 0.82 (2%) | 0.84 (2%) | 1.11 (2%) | 0.54 (1%) | 1.44 (3%) | 0.66 (1%) | 1.06 (2%) | 0.84 (2%) |
| Total Fat (g) | 0.46 (1%) | 0.50 (1%) | 0.38 | 0.19 | 0.10 | 0.14 | 0.39 (1%) | 1.16 (1%) | 0.32 | 10.68 (14%) |
| Total Carbohydrates (g) | 32.10 | 12.50 | 14.98 | 8.16 | 6.58 | 9.09 | 9.80 | 16.97 | 10.55 | 6.26 |
| Dietary Fiber (g) | 5.4 (19%) | 3.0 (11%) | 1.6 (6%) | 0.9 (3%) | 0.9 (3%) | 0.8 (3%) | 1.7 (6%) | 7.5 (27%) | 1.7 (6%) | 3.2 (11%) |
| Sugar (g) | 20.14 | - | 13.66 | 7.86 | 5.69 | 8.12 | 8.10 | 8.31 | 7.89 | 0 |
| Vitamins | ||||||||||
| Vitamin C (mg) | 23.0 (26%) | 14.0 (16%) | 36.4 (40%) | 36.7 (41%) | 21.8 (24%) | 18.0 (20%) | 36.4 (40%) | 92.5 (103%) | 5.4 (6%) | 0.9 (1%) |
| Thiamin (mg) | 0.013 (1%) | 0.020 (2%) | 0.028 (2%) | 0.041 (3%) | 0.015 (1%) | 0.038 (3%) | 0.029 (2%) | 0.015 (1%) | 0.034 (3%) | 0.003 |
| Riboflavin (mg) | 0.116 (9%) | 0.040 (3%) | 0.038 (3%) | 0.019 (1%) | 0.031 (2%) | 0.012 (1%) | 0.101 (8%) | 0.018 (1%) | 0.027 (2%) | 0.000 |
| Niacin (mg) | 1.432 (7%) | 0.400 (2%) | 0.669 (3%) | 0.734 (4%) | 0.232 (1%) | 0.418 (2%) | 0.620 (3%) | 0.290 (1%) | 1.125 (6%) | 0.037 |
| Pantothenic Acid (mg) | 0.397 (8%) | 0.103 (2%) | 0.197 (4%) | 0.105 (2%) | 0.084 (2%) | 0.155 (3%) | - | 0.180 (4%) | 0.185 (4%) | 0.015 |
| Vitamin B6 (mg) | 0.720 (42%) | 0.100 (6%) | 0.119 (7%) | 0.072 (4%) | 0.163 (10%) | 0.088 (5%) | 0.050 (3%) | 0.021 (1%) | 0.025 (1%) | 0.009 (1%) |
| Folate (mcg) | 7 (2%) | 14 (4%) | 43 (11%) | 21 (5%) | 8 (2%) | 19 (5%) | 6 (2%) | 8 (2%) | 5 (1%) | 0 |
| Vitamin B12 (mcg) | 0 | 0 | 0 | 0 | 0 | 0 | 0 | 0 | 0 | 0 |
| Vitamin A (IU) | 143 (3%) | 230 (5%) | 1082 (22%) | 3382 (68%) | 0 | 50 (1%) | 25 (1%) | 74 (1%) | 332 (7%) | 403 (8%) |
| Vitamin E (mg) | 2.11 (7%) | - | 0.90 (3%) | 0.05 | 0.05 | 0.02 | 0.87 (3%) | 1.25 (4%) | 0.77 (3%) | 1.65 (6%) |
| Vitamin K (mcg) | - | - | 4.2 (4%) | 2.5 (2%) | 2.5 (2%) | 2.9 (2%) | 7.8 (7%) | 11.9 (10%) | 2.2 (2%) | 1.4 (1%) |
| Minerals | ||||||||||
| Calcium (mg) | 18 (1%) | 11 (1%) | 11 (1%) | 9 (1%) | 11 (1%) | 6 | 39 (3%) | 46 (4%) | 6 | 88 (7%) |
| Iron (mg) | 0.78 (4%) | 0.70 (4%) | 0.16 (1%) | 0.21 (1%) | 0.34 (2%) | 0.17 (1%) | 1.85 (10%) | 0.38 (2%) | 0.28 (2%) | 3.30 (18%) |
| Magnesium (mg) | 11 (3%) | 16 (4%) | 10 (3%) | 12 (3%) | 11 (3%) | 10 (3%) | 18 (5%) | 20 (5%) | 9 (2%) | 4 (1%) |
| Phosphorus (mg) | 26 (2%) | 11 (1%) | 14 (1%) | 15 (1%) | 5 | 11 (1%) | 38 (3%) | 10 (1%) | 26 (2%) | 3 |
| Potassium (mg) | 454 (10%) | 47 (1%) | 168 (4%) | 267 (6%) | 182 (4%) | 228 (5%) | 194 (4%) | 244 (5%) | 201 (4%) | 8 |
| Sodium (mg) | 7 | 15 (1%) | 1 | 16 (1%) | 9 | 18 (1%) | 10 | 3 | 0 | 735 (32%) |
| Zinc (mg) | 0.19 (2%) | 0.10 (1%) | 0.09 (1%) | 0.18 (2%) | 0.07 (1%) | 0.09 (1%) | 0.12 (1%) | 0.09 (1%) | 0.17 (2%) | 0.22 (2%) |
| Copper (mg) | 0.213 (24%) | 0.086 (10%) | 0.111 (12%) | 0.041 (5%) | 0.060 (7%) | 0.024 (3%) | 0.060 (7%) | 0.041 (5%) | 0.086 (10%) | 0.251 (28%) |
| Manganese (mg) | 0.204 (9%) | - | 0.063 (3%) | 0.041 (2%) | 0.035 (2%) | 0.027 (1%) | - | 0.248 (11%) | 0.054 (2%) | 0.020 (1%) |
| Selenium (mcg) | 0.6 (1%) | 0.6 (1%) | 0.4 (1%) | 0.4 (1%) | 0.7 (1%) | 0.6 (1%) | 0.4 (1%) | 0 | 0.9 (2%) | |
| Fatty Acids | ||||||||||
| Saturated Fat (g) | 0.169 (1%) | 0.136 (1%) | 0.092 | 0.051 | 0.025 | 0.038 | 0.027 | - | 0.025 | 1.415 (7%) |
| Monounsaturated Fat (g) | 0.102 | 0.205 | 0.140 | 0.003 | 0.002 | 0.003 | 0.041 | - | 0.088 | 7.888 |
| Polyunsaturated Fat (g) | 0.097 | 0.079 | 0.071 | 0.081 | 0.039 | 0.059 | 0.207 | - | 0.113 | 0.911 |
Unless specified, all fruits in this table are raw.
Unless specified, all canned fruits in this table are packed in water, solids
and liquids, no added sweeteners.
Frozen fruit in this table is unsweetened.